[Free] Basics Of Seaborn For Data Analysis &Amp; Data Science In Python
Learn basics of seaborn , frequent used seaborn plots , styling in seaborn with the help of real-world use-cases – Free Course
What you’ll learn
- Learn about Essentials of seaborn to create plots like Bar Charts, Line Charts, Scatter Plots, Histogram ,distribution plots , and more!
- How to update Layouts with seaborn
- Learn styling in seaborn
- Learn basic functionality when to use seaborn
Requirements
- Have a Keen Desire to learn !
Description
In this course, you will learn how to create interactive Visuals in python using the seaborn data visualizations library
This course will teach your everything you need to know to use Python to create interactive visuals with seaborn Have you ever wanted to take your Python skills to the next level in data visualization? With this course you will be able to create fully customization plots , interactive visuals with the open source libraries like seaborn
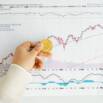
Data visualisation is very critical for generating and communicating easy to understand finding and insights. Either you are a Data Analyst who wants to create a dashboard/present your analysis or you are a Data Scientist who wants to create a UI for your machine learning models, seaborn can be a boon for both.
You will learn in this course many chart types..
Bar chart
Line cart
Pie chart
Scatter plot
Histogram
Box plot
Violin plot
Distribution (KDE) Plot
We’ll start off by teaching you enough Python and Pandas that you feel comfortable working and generating data Then we’ll continue by teaching you about basic data visualization with seaborn, including scatter plots, line charts, bar charts , box plots, histograms, distribution plots and many more ! We’ll also give you an intuition of when to use each plot type.
By taking this course you will be learning the bleeding edge of data visualization technology with Python and gain a valuable new skill to show your colleagues or potential employers.
Author(s): Shan Singh